If we want to understand domestic wood burning and its impacts we really need to understand where wood burners are across our towns, cities and rural areas.
Domestic wood burning is a significant source of small particle matter (PM2.5) pollution in the UK, contributing over 10% of total PM2.5 emissions in the UK in 2023, with the domestic use of other solid fuels bringing this up to a whopping 20% of PM2.5 emissions across the nation. Wood burning is the only major source of PM2.5 to have increased in the UK over the 20 years to 2023 and it is important to understand where this increase might be coming from, and which communities are being most affected by this increase.
To try to find out the distribution of wood burning across the country a research team at University College London has been mapping Energy Performance Certificate data and Census 2021 data to develop a heatmap showing the prevalence, and concentration of solid fuel heating.
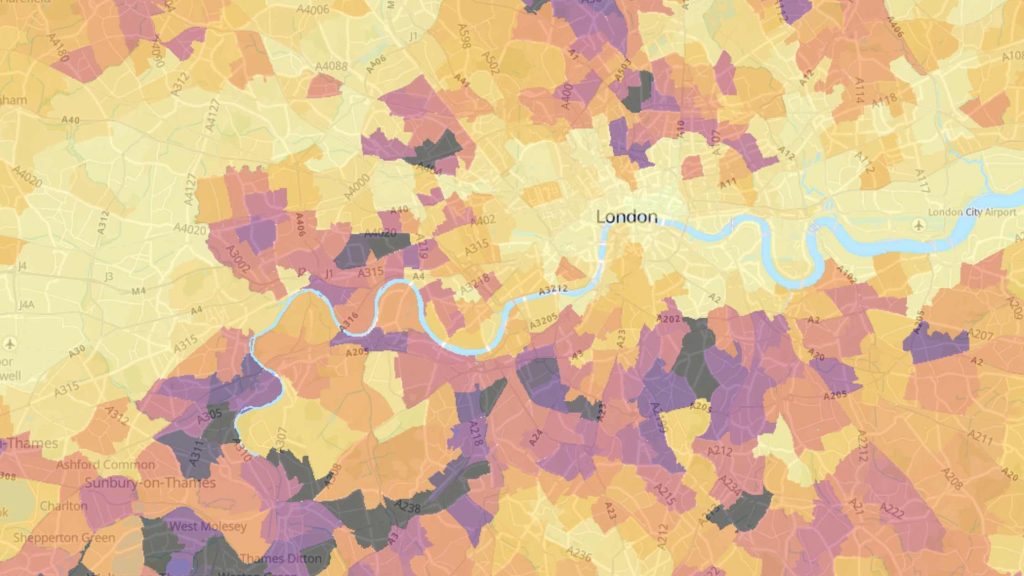
They have uncovered a wide variation in the distribution of wood and other solid fuel heating across our towns, cities and rural areas. Unsurprisingly a much higher percentage (26%) of households in rural areas have wood or solid fuel burners compared to urban areas (5.7%). What was more surprising is that the number of wood or solid fuel burners per km2 was higher in urban areas at 62.5, where rural areas have 30.8 per km2. There is twice the concentration of wood and solid fuel burning stoves in the urban areas where over 80% of the population live, which could lead to increased pollution levels and increased health impacts in urban areas.
Read more about it here and use the interactive map to see the number of solid fuel heaters per km2 in your local area.


